Technical Deep-Dive

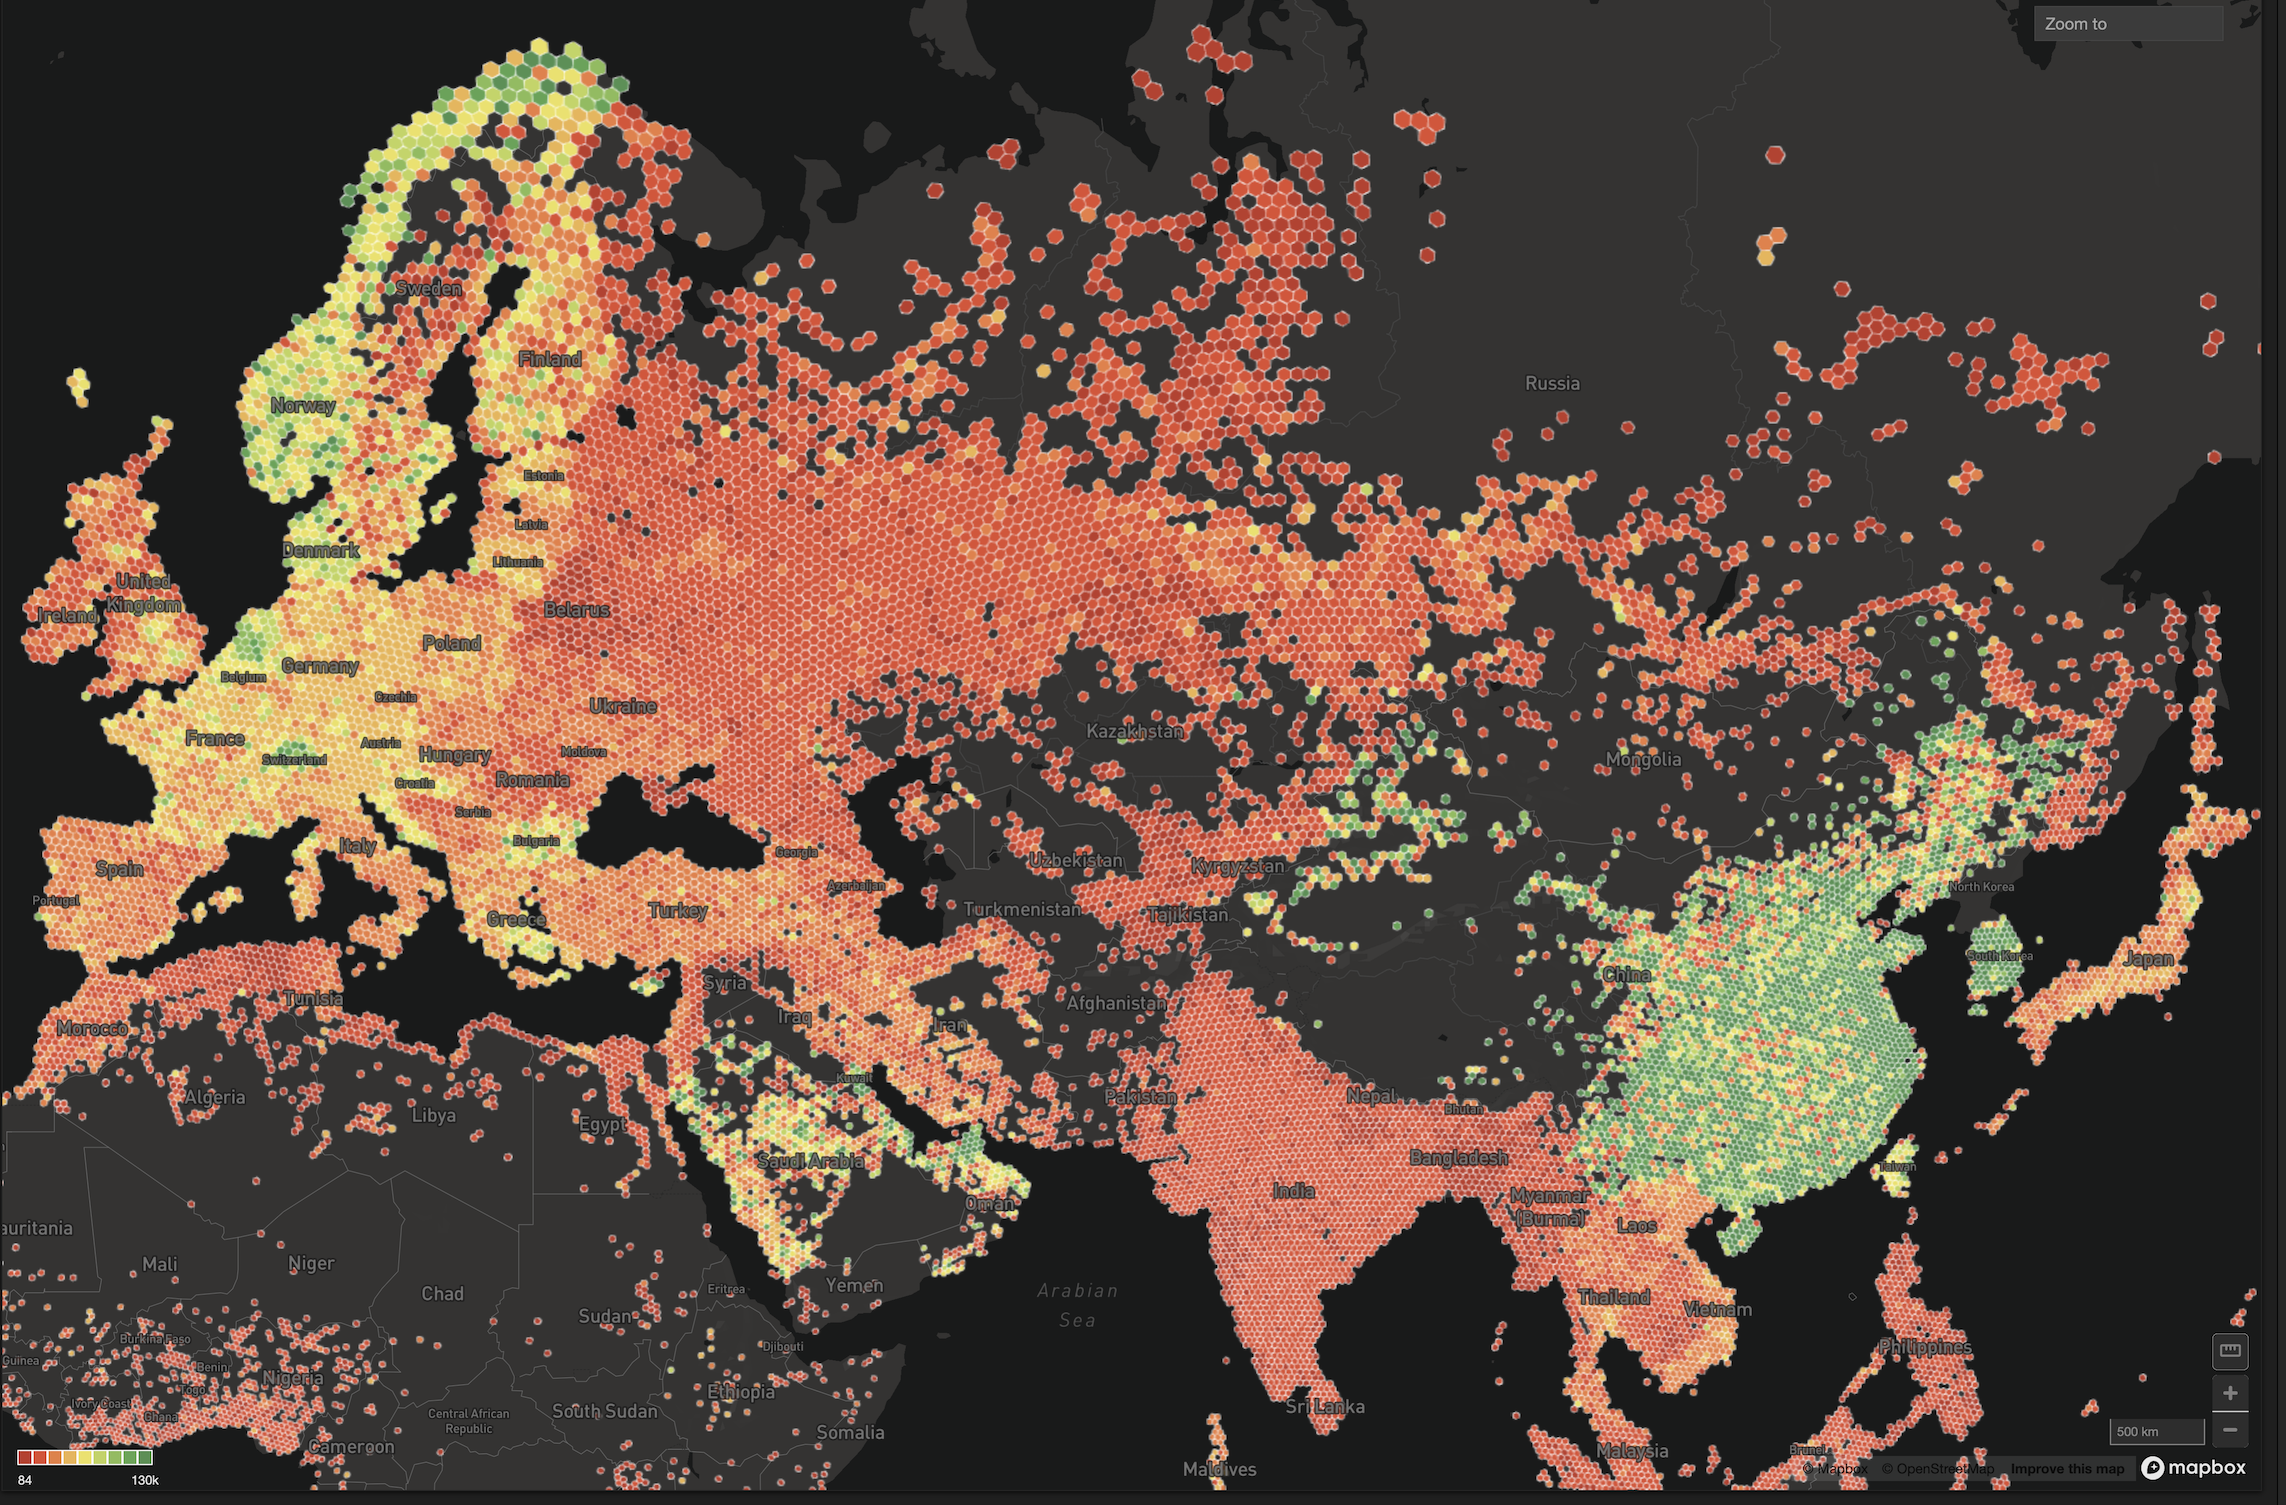
Learn the benefits of using OmniSci to ingest real-time satellite location data and how we can utilize the loading, visualization, and querying aspects of the product to find insights.

In this article, we'll demonstrate the ease of using Jupyter notebooks with open source Python libraries for visual charts to interact with data in OmniSci Database on a Mac.


We are actively preparing the release of Immerse 5.5. When you will open it, you will be invited to use our new chart architecture. Why should you care? You should not. Just try it and enjoy faster and more robust charts.

Thank you to Robert Luciani for writing this guest post. He is from Foxrane, an OmniSci partner, and has supplied the logistics dataset and expertise used in OmniSci software.

Businesses are drowning in data but starving for insight, making the hiring of a data science team vital. But what makes up a data science team? What are the best practices for data science workflows? And what do data scientists need to execute their data science workflow to the best of their ability?
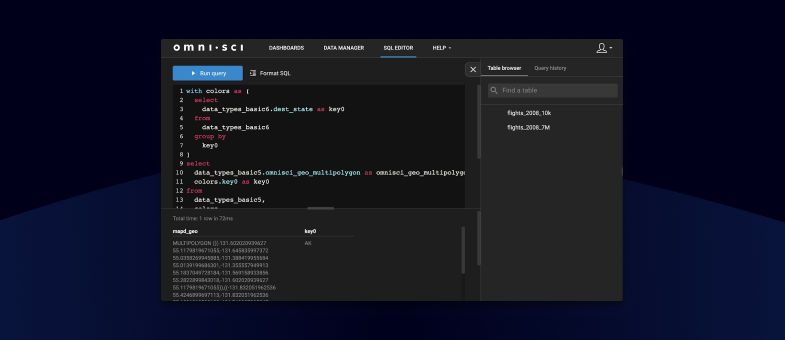
We’ve listened to your feedback, and the result is an easier and faster Immerse SQL Editor with our recent 5.2 release. Find out how the updated platform allows you to run selected queries, incorporate query snippets and run previous SQL statements.

To genuinely understand reservoir behavior, the oil and gas industry needs tools that can track and analyze data over long periods of time and for many unique variables. This post shows examples of tracking reservoir behavior across time. Traditional BI and GIS tools are too restrictive but with OmniSci's GPU and CPU innovations, accelerated analytics on billions of rows of data becomes possible.

MapD is a next-generation data analytics platform designed to process billions of records in milliseconds using GPUs. It features a relational database backend with advanced visualization and analytic features to enable hyper-interactive exploration of large datasets.